
Every month I’m sharing the progress of the blog, audience, and sales for Recharge Workshop. Starting a website isn’t easy and sometimes the numbers can be depressing. So I hope that sharing these stats will help motivate you to keep going with your project or business.
If you’ve got questions or want to see more details behind the scenes, let me know down in the comments. I’d be happy to share anything! Click here to see all the Growth Stats posts or if you missed last month, you can see it here: Oops, I Forgot to Blog! – Growth Stats – April 2017.
Statistics for May 2017
Another lackluster month for consistency and numbers. But that’s all I’m going to say about it. You already know we’re moving soon, so you know I’m busy. And who cares? We’re all busy! Let’s focus on the positives and figure out some lessons to learn.
Social Media
On Facebook, I’m now trying to share at least one post a day. I’m getting most of my content from the DIY blogging group I joined. It’s really nice to be able to help other bloggers share their content and know that they are doing the same for you. I have seen only a slight increase in engagement from this, but I suspect that it’s a waiting game.
This month, I have been making a better effort on Twitter too. I don’t currently share everything I share on Facebook, but I’d like to try that. A tool that would help me post once and have it shared multiple places would be very helpful. I am seeing some growth on Twitter so I’m going to double-down on my efforts.
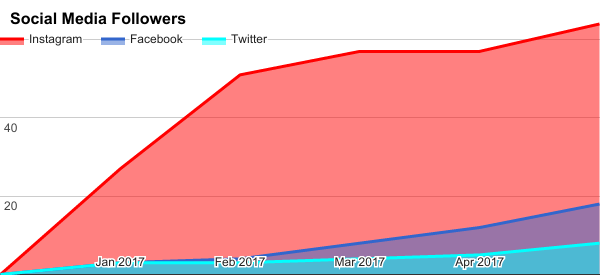
You’ll now see I have 64 followers on Instagram, 18 likes on my Facebook page, and 8 follows on Twitter. All solid improvements after a couple stale months.
Website
If you visited the blog in May, you didn’t see anything spectacular. The most popular post was about how to make a steel bow tie. I did manage to post 5 times and I got some new comments. Just like last month, I can’t be surprised by the numbers if I don’t have much new content.
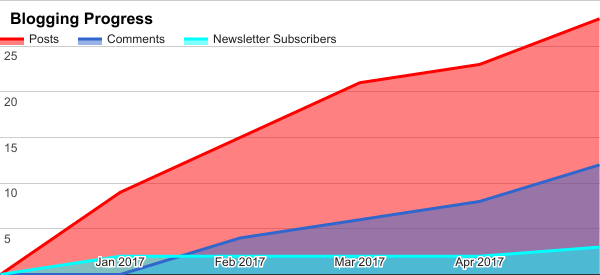
5 posts were added in May. There’s now 1 new newsletter subscriber. This month saw 4 new comments.
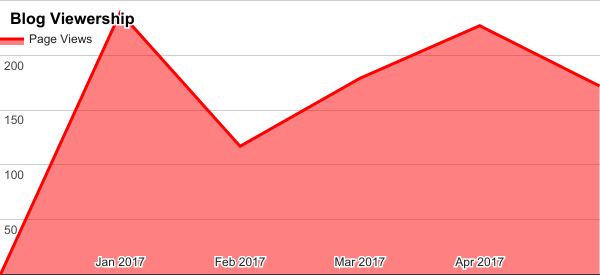
172 new page views this past month. I’m honestly surprised by this. I have a larger social following than ever and I’m sharing more often and having my posts shared more often by others. So having my page views drop was the opposite of what I had expected. This just goes to show you that social media performance does not guarantee website success.
Etsy
You’ll never guess what happened this month! Oh, wow! You did guess and you’re right… I didn’t produce any products again and I didn’t see any stats change on my Etsy shop. It’s crazy how that works, isn’t it?
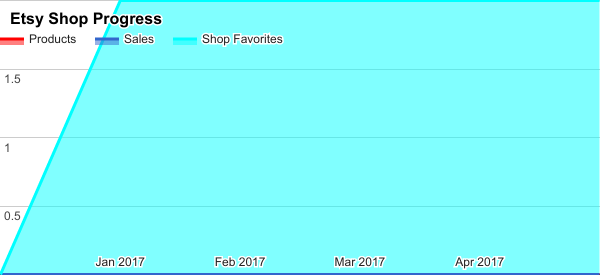
0 products, 0 sales, and 0 new follows. Maybe we’ll sell our house and buy a new one super quick and I’ll finally have time to make something and sell it… Maybe I’m dreaming.
Actions to Take
I have a lot on my to-do list for blog posts. I need to actually create them. Based on the social stats, I think it’s safe to say that engaging more on Twitter and sharing more on Facebook are worthwhile endeavors. It’s not always easy, but using tools like Facebook’s scheduled posts can really help to reduce the amount of time spent on the computer each week.
I shall keep at it and try to improve my consistency in June.
I’m still looking for contributors to the blog. I think it’s a great opportunity for someone to publish content that they don’t have to curate or maintain and promote their brand with little effort. If you’d like to be a guest author, read more here!
I want your feedback!
Please let me know if you find this post interesting. If you have questions or suggestions, please add them in the comments below. I’d love to hear your thoughts.
Thanks for following along and I hope these stats are helpful to you in your journey too!