
Every month I’m sharing the progress of the blog, audience, and sales for Recharge Workshop. Starting a website isn’t easy and sometimes the numbers can be depressing. So I hope that sharing these stats will help motivate you to keep going with your project or business.
If you’ve got questions or want to see more details behind the scenes, let me know down in the comments. I’d be happy to share anything! Click here to see all the Growth Stats posts or if you missed last month, you can see it here: I Lost Half My Instagram Audience! – Growth Stats – March 2017.
Statistics for April 2017
This past month I did a lot of behind the scenes work. And unfortunately, not much else.
We are prepping our house to put it on the market soon. I have a lot to do and I let it consume me in April. I need to spend some time in the workshop and on this blog too. Hopefully that will change for May. I made a bunch of changes to the site in terms of code and features as well. So I felt like I was always working on the blog, even though I wasn’t posting anything.
Focusing on the positives, we had our first guest post, the new author page feature was created, the private Facebook group for DIY bloggers is helping me reach a larger audience,
Social Media
I didn’t blog, and I didn’t post – at least not to Instagram. So it’s no surprise I saw no growth there. It went up and down and settled at the same spot it was last month. I can do better, I know exactly what to do, but I just need to follow through.
Facebook likes on my page increased by 4 for the third month in a row. Not bad. I want to share from other sites more (maybe 4 or 5 times each week) to see if growth has more to do with consistency of content than original ideas.
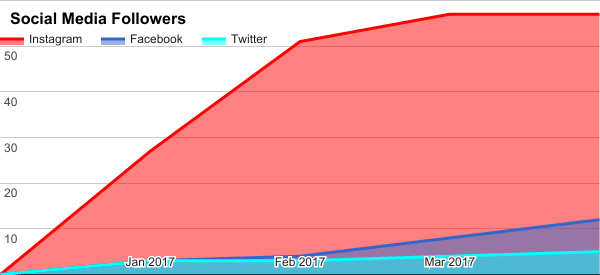
I have 57 followers on Instagram again, there are 12 likes on my Facebook page, and I’ve ramped Twitter up to a whopping 5 follows.
Website
March April was a bad blogging month. Ugh, I wrote that last month!
My wife published a 4 Pallet Friday post as a guest author and I published last month’s copy of Growth Stats. I’m not going to give up though. This is just a temporary setback. Honestly, the website stats look very good considering there was almost no new content.
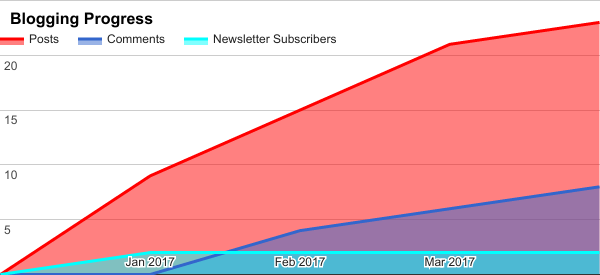
2 posts were added in April. 0 new newsletter subscribers. Another 2 new comments.
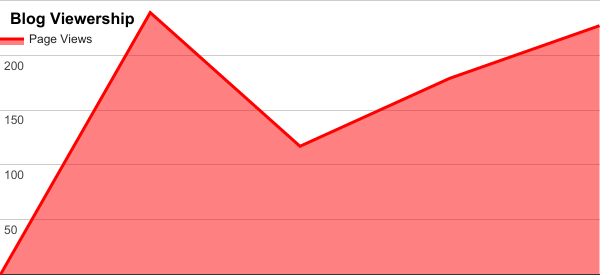
227 new page views this past month, when almost nothing was published and very little was promoted. That means the blog now has enough content to warrant a little exploring and the Facebook group I’m in is helping me share posts with a larger audience. I need to capitalize on that next month and produce engaging content to really increase my traffic.
Etsy
If you’re reading this, go follow my Etsy shop. Just do it to make me happy. Until I actually put something up for sale, you are my only hope!
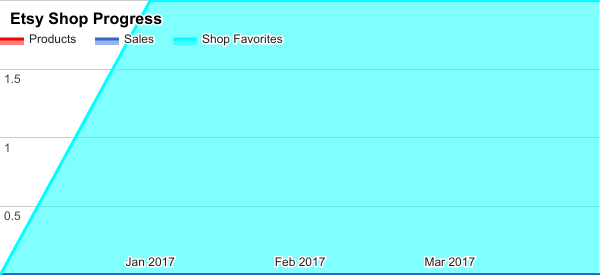
0 products, 0 sales, and 0 new follows. Duh. Again.
Actions to Take
Honestly, there’s nothing here worth jotting down. I failed to publish anything so my numbers didn’t increase. But since they didn’t plummet either, I think the takeaway is that I’ve been successful in creating, designing, and curating the blog thus far. If it stands on its own without constant input, is it not a success? A little something worth remembering after all.
I reached out to a few makers this month, asking for guest posts. I was rejected on all but one request. Nothing set in stone, but a potential future maker story that I’m looking forward to. I’ll focus this month on blogging more and reaching out to more makers. (If you want to contribute, click here!)
I want your feedback!
Please let me know if you find this post interesting. If you have questions or suggestions, please add them in the comments below. I’d love to hear your thoughts.
Thanks for following along and I hope these stats are helpful to you in your journey too!